Overheard by the coffee machine: “What’s the point of all this?”
Many of us know the feeling of racing through tasks — without really knowing whether what we’re doing actually creates value. In this article, Kristian Brønner shares a case that shows how clear metrics brought meaning and motivation to a large manufacturing company.


13
min read
October 28, 2025
Læs dette blogindlæg på dansk
You probably know the feeling: you’re in the zone. Tasks get done one after another, and it feels both efficient and satisfying. But in the middle of that good rhythm, a nagging thought can sneak in. Maybe someone even puts it into words by the coffee machine: “What’s the point of all this?” or “How does what we’re doing actually create value?”
That moment of reflection often comes only after the work is done, when we have to admit that the outcome didn’t create the value we were aiming for. Sometimes we can’t even tell what impact it had, simply because we never defined what success would look like in the first place. When we spend our days solving problems and crossing off tasks, it’s easy to lose sight of how our daily work connects to the bigger picture of value creation.
In this piece, I’ll share insights from a real case where this exact dilemma emerged in a manufacturing company. I’ll also explore how we, as professionals, can gain a deeper understanding of the value chain we’re part of – and why it’s worth investing time in that understanding.
Using the case as a starting point, I’ll show how we can draw a clearer line between the work we do and the value it creates – for users, for the product, and for the organization.
My hypothesis is that when we understand the purpose behind what we do, it not only strengthens the results – it also builds motivation, a sense of satisfaction, and pride in the work we deliver.
My hypothesis is that when we understand the purpose behind what we do, it not only strengthens the results – it also builds motivation, a sense of satisfaction, and pride in the work we deliver.
The Efficiency of Meaninglessness
In 2022, I worked with a manufacturing company that needed help streamlining its processes to gain more autonomy and deliver results that truly created value. The department I collaborated with was what you’d typically call a research and development team—or R&D. Their job was to ensure continuous innovation that benefitted both the company’s production setup and its end users. The department was measured on its ability to improve both product quality and production efficiency.
The challenge was that, unlike their counterparts in production, they struggled to show clear results. The production teams worked with well-defined KPIs that everyone could understand, such as the number of units produced within a given time frame. The R&D department, however, found it difficult to document their impact. To someone looking in from the outside, it might have seemed as though they weren’t delivering—but that wasn’t the case at all.
The first few days I spent with the department were all about understanding their work and processes. The team members eagerly showed me how they carried out research and testing that would ultimately benefit the company’s production. I’ve rarely met a group so dedicated and passionate about both their work and their organization. The department was running countless experiments and tests, and every day they could explain what they had done and what the results were. They were clearly producing plenty of results, but did those results actually create value?
After those first few days, it was clear to me that the team could deliver—but something was off.
When I started asking what each experiment was meant to achieve, a pattern began to emerge: the department jumped straight into “experiment mode” without clarifying the actual outcome the company was aiming for. The result was often endless testing with no clear sense of when enough was enough or whether the results created any real value in the broader value chain.
They loved researching and experimenting but forgot to ask the essential questions: “Why are we running this experiment?” and “When will we know we’ve achieved the result we want?”
The lack of alignment on expectations made the department appear inefficient – both to stakeholders and internally, where a sense of meaninglessness began to creep in. Motivation and morale started to fade, even though their commitment to the work remained high. What they needed was a clear connection between what they delivered, the value they aimed to create, and the expectations of the people around them.
What they needed was a clear connection between what they delivered, the value they aimed to create, and the expectations of the people around them.
It can be hard to realize you’re off track when you’re caught up in the details and get to geek out on technology, expertise, and in this case, new production materials. That was exactly the situation in the department I worked with: employees who loved to dive deep into their work but lacked clear markers to guide their direction.
In situations like this, it can be healthy to slow down, take a step back, and get a clear view of what you actually want to achieve with your work and the results it produces. One useful approach is to use Syndicate’s Chain of Reasoning model (COR), a strategic tool that visualizes the connection between an organization’s investments and its outcomes. The model links inputs, activities, and outputs to the value created for both customers and the business across the entire value chain.
COR consists of six categories.
Three relate to the organization’s structure and results:
- Input
- Efficiency
- Output
The other three focus on the impact of those results:
- Customer
- Product
- Business
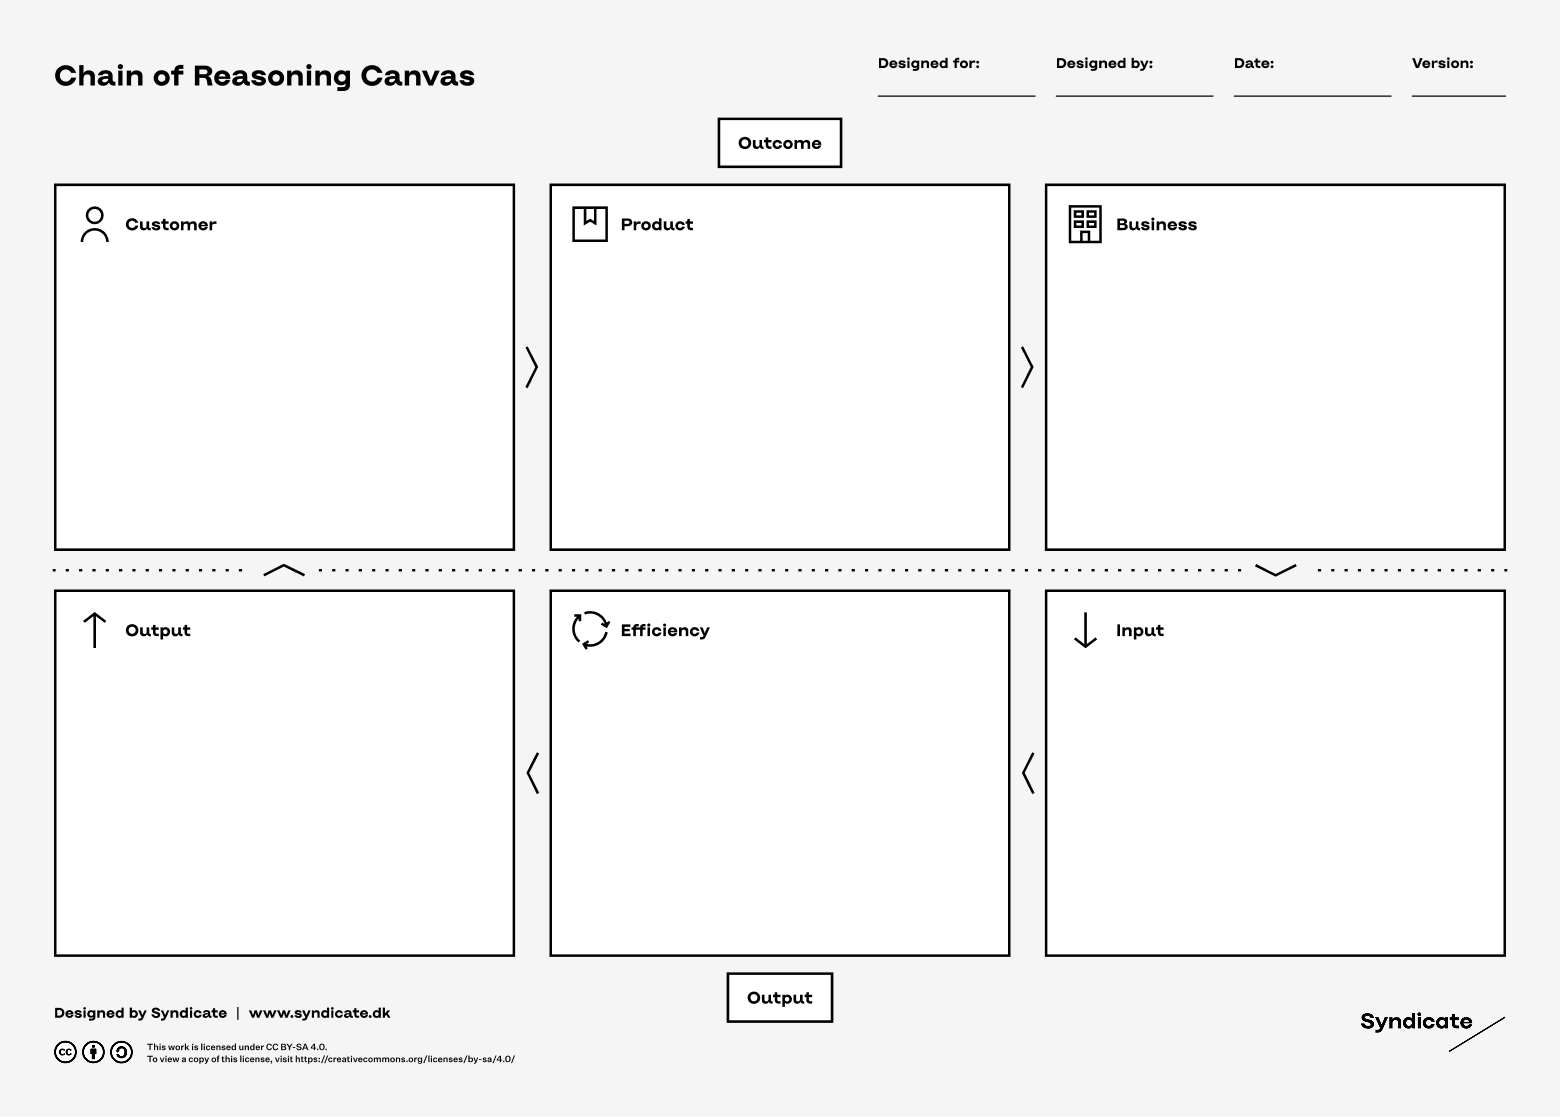
By analyzing all six categories, you can identify the most meaningful metrics for the situation at hand. In many cases, metrics already exist within the organization, especially at the business level, and they can help create stronger alignment across the value chain.
To get started working with metrics, I introduced the COR model to the department and walked them through the principles behind it. I recommend dedicating a workshop to this purpose (you can find a workshop guide on the COR Canvas page – in Danish) and involving people with different areas of expertise, as that mix tends to create the best results.
A crucial starting point when working with the value chain and the COR model is deciding which perspective you want to analyze it from. The lens you choose has a major influence on the outcome of the analysis.
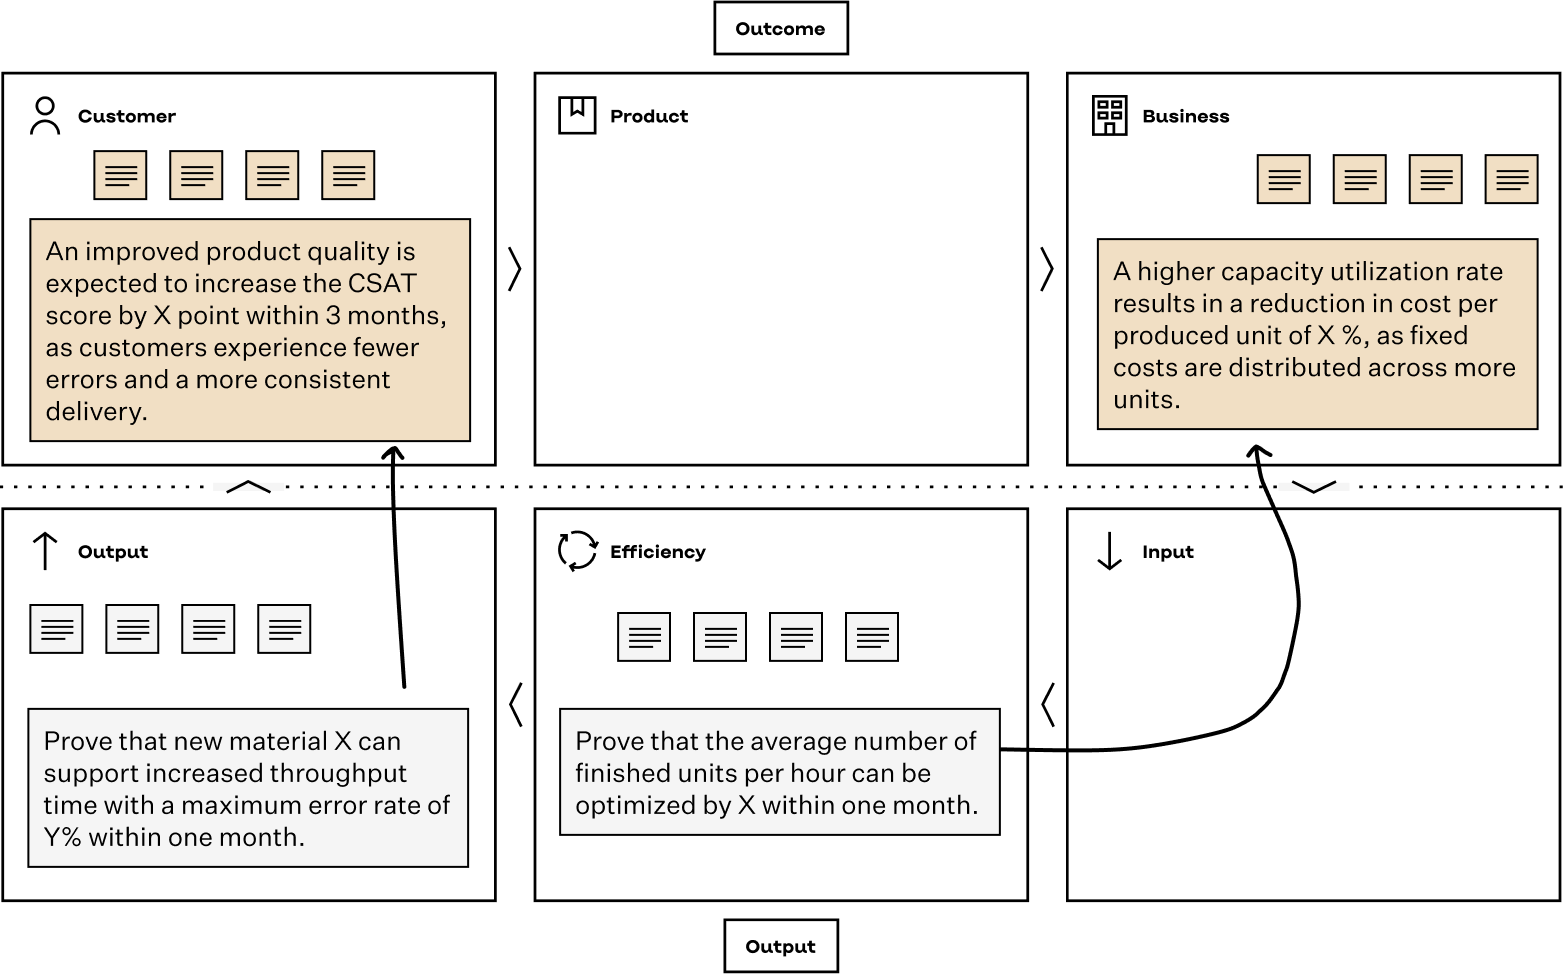
In our case, we could easily have viewed ourselves as a separate unit, with production as our internal customer and our work as a product delivered to them. But we quickly realized it would create more value to see ourselves as an integrated part of production and focus instead on optimizing overall efficiency. The department’s own efficiency was already high, so the goal became improving the efficiency of production itself. As a result, our analysis led to metrics under Efficiency, aimed at enhancing production performance, and metrics under Output, focused on the quality of what came out of production. In this way, the “customer” in our analysis was not an internal one, but the company’s actual end customer.
The perspective you choose plays a key role in shaping a self-image and focus that make sense in the situation. There’s no right or wrong point of view – what matters is being deliberate about the choice and picking the starting point that creates the most value.
We analyzed our value chain and its success criteria using the model as a framework and selected a few metrics that could create visible results for the production track:
- Efficiency: Demonstrate that the average number of finished units per hour can be improved by X within three months.
- Output: Demonstrate that the new material X can support increased throughput with a maximum error rate of Y% within three months.
The first metric focused on supporting a more efficient production process. The second balanced two factors: enabling production to adopt a new material while ensuring that the material maintained a level of quality that could withstand a faster pace and, in turn, improve overall output.
Put simply, we found a few meaningful goals that made it easy to see what we were actually aiming for and how our work made production both faster and better.
Although the metrics were aimed at two areas of the COR model, the analysis showed that they also influenced other parts of the value chain. For example, higher quality turned out to affect metrics related to Customer, while increased production capability strengthened those linked to Business.
Metrics should always be short, specific, and measurable, with numbers and a timeframe that reflect the level of ambition. That’s why we spent time identifying baseline data for throughput and error rates, ensuring that the goals were realistic and grounded in facts. From there, the department could define the metrics, present them to stakeholders, and make adjustments together. This process created alignment and shared ownership, making conversations about results far more structured and engaging.
After gaining buy-in, the team defined tasks and experiments that would support the goals. They were already experts at doing the work, but now they had a clear focus and a shared end goal.
Hitting pause, stopping the flow, and reflecting on the value you’re actually creating can feel unnatural for many people. It also takes time and effort to gather the data needed to support meaningful metrics. My advice is not to create a flood of metrics all at once. Start with the most valuable ones – the ones where you can quickly see results and evidence of value. That momentum will motivate you to take the next step. Work with metrics iteratively, building on your ambitions gradually and letting both the organization and its surroundings guide the pace. As in the example above, the first metrics were aimed at production, because that’s where results and feedback could be achieved the fastest.
Put simply, we found a few meaningful goals that made it easy to see what we were actually aiming for and how our work made production both faster and better.
The Three M’s: Metrics, Meaning, and Motivation
Working with metrics isn’t just about structure and flow, it’s also about meaning and motivation. The clearer the sense of purpose behind your work, the more motivated you become.
When the department began tracking tangible results, they could show stakeholders week by week how close they were to reaching their goals. That created greater insight and satisfaction externally, while inside the department a new sense of pride began to grow.
Suddenly it became clear how each task contributed to something bigger, and the employees could present their results with confidence. The metrics removed any hesitation around talking about progress, because everyone agreed that it mattered. From one week to the next, team members could show exactly how much closer they were to reaching their goal of X.
Today, the department still uses metrics whenever it makes sense, and they’ve even inspired other teams to ask the same question: What value are we actually chasing with the work we do? It’s not an easy practice to take on, but once metrics become part of everyday work, the payoff is significant—for the business, for customers, and for employee motivation.
Build on What Already Works
In my experience, it can be hard to take in new ways of thinking and working—in short, we hate change. When I bring up the idea of working with metrics and measuring value creation, I can almost see people’s eyes glaze over.
That’s partly because we’re constantly being introduced to new ways of working and new frameworks. Over time, many employees become almost immune to change initiatives. But I’ve found that working with metrics is different. It builds on what we already do and doesn’t require a complete overhaul. In the example above, it simply helped the department get more value out of the framework they were already using.
The department had been working as a Scrum team for quite some time and had established a solid structure and a good flow. But they struggled to generate real value from their events, especially their reviews.
With the introduction of metrics, that began to change. The team started presenting which metrics they were working toward and why those particular ones mattered at that point in time. When they showed their work, they could link it directly to how it affected the metrics and how much closer they were to reaching their goal.

It turned out to be a highly effective way of presenting results and made everyone in the room invested in what was being shared. The metrics were also used when the team planned upcoming work—only tasks that supported the current metrics made it onto the plan.
At the same time, I worked on making the metrics visible in daily life. We put them up on the office wall as a constant reminder and a guide for our work.
Metrics shouldn’t be seen as a new framework or a transformation of how you work. They’re a tool that helps you create value within the structure you already have.
Metrics shouldn’t be seen as a new framework or a transformation of how you work. They’re a tool that helps you create value within the structure you already have.
There HAS to Be Meaning to It All
Of course there should be meaning in the work we spend so much of our everyday lives on. That’s usually the intention from the start, but somewhere in the rush of daily tasks, projects can slip in that are hard to connect to the actual value we’re trying to create.
It can feel deeply discouraging to do work you’re proud of, only to realize afterward that it didn’t align with what the company was trying to achieve.
That’s why it’s important to pause, make sure you’re heading in the right direction, and keep an eye on whether you stay on course.
As shown in this example, it often makes sense to weave metrics naturally into the structures and processes you already have. And even though developing them can be demanding, the process itself is a healthy and worthwhile journey toward finding the point of it all.
PS. For the metric nerds…
If you’d like to dive deeper into metrics and the COR model, visit syndicate.dk/cor (in Danish) — and feel free to reach out if you’d like a hand getting started.


